
Audience Insights
Learn how to understand who is in an Audience before you activate it.
Introduction
Use Audience Insights to understand, evaluate, and communicate an Audience's characteristics. Explore its size, contactability, demographics, geography, and other attributes, compare it with another Audience or population, and build custom reports to surface the insights that matter.
Audience Insights is separate from the Campaign tab. Use Insights to understand the people in an Audience. Use Campaign to review campaign performance for activated Audiences.
NoteIf you bookmarked this page when it covered campaign performance reporting, that content now lives in Audience Campaign. The Insights tab now refers to Audience composition and profile reporting.
Availability
The Insights tab is available on Audience pages. Audience Acuity (AA) data requires an Audience Acuity subscription. Contact your GrowthLoop team if you want to use AA-powered Insights.
What you can review
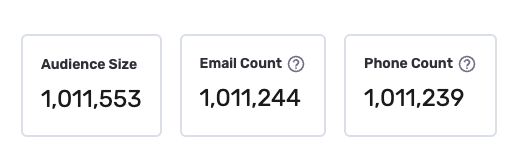
The Insights tab starts with summary counts:
- Audience Size: the number of members in the Audience.
- Email Count: the number of Audience records with an email address in the mapped email field.
- Phone Count: the number of Audience records with a phone number in the mapped phone field.
Email and phone counts use the fields mapped for Audience Insights. Counts may differ from exported email or phone totals if an export uses different fields.
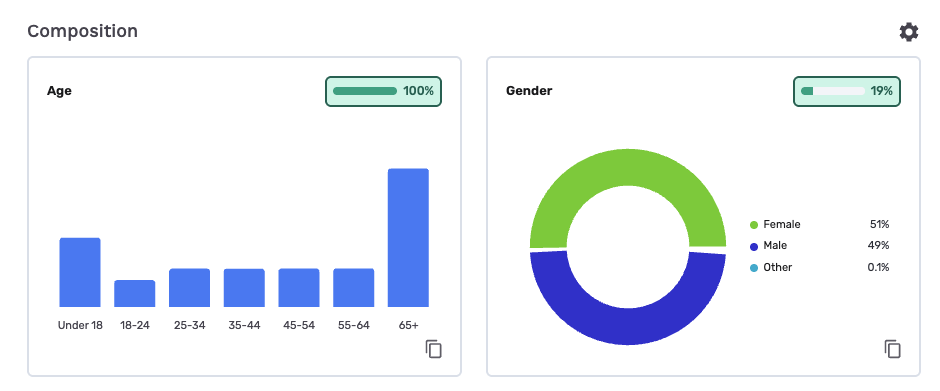
The tab then displays standard graph sections:
- Composition: age, gender, household income, language, homeownership, children in household, and Audience Acuity demographics such as education, occupation, household composition, and age of children.
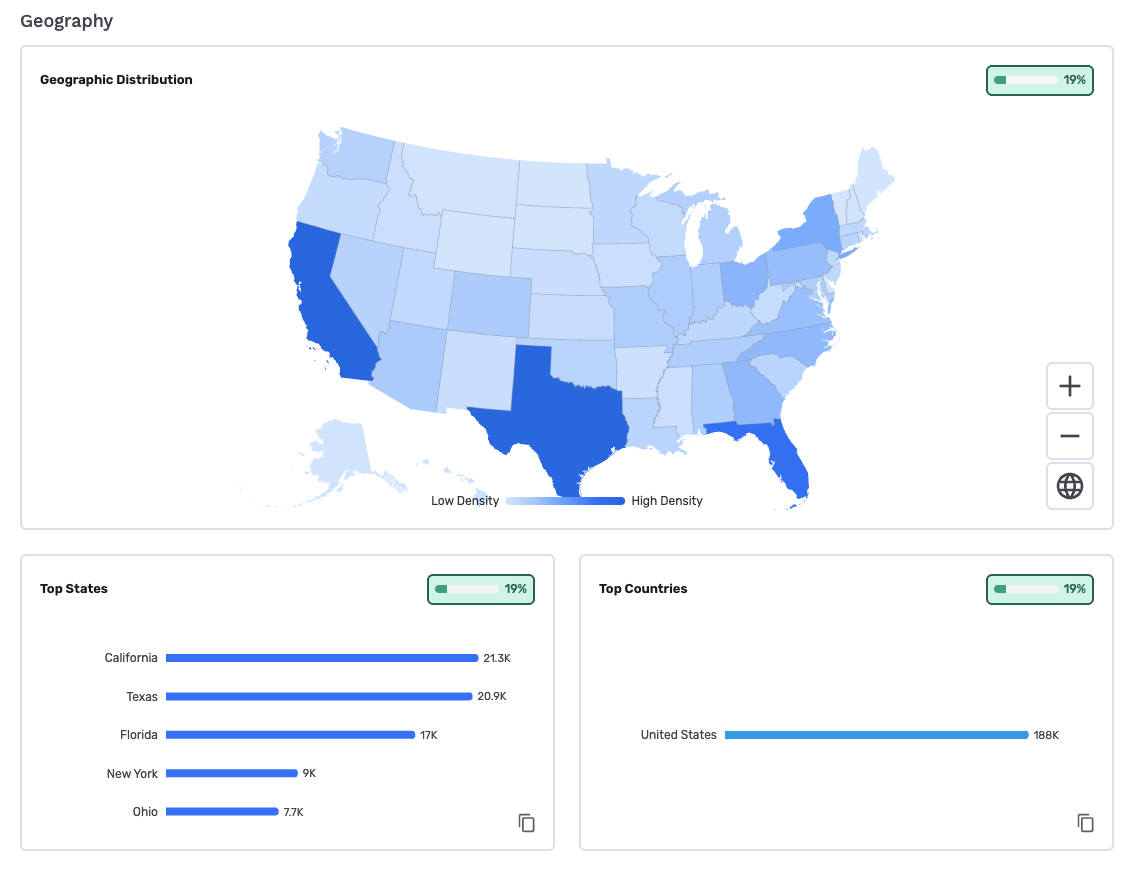
- Geography: a map, top states, and top countries.
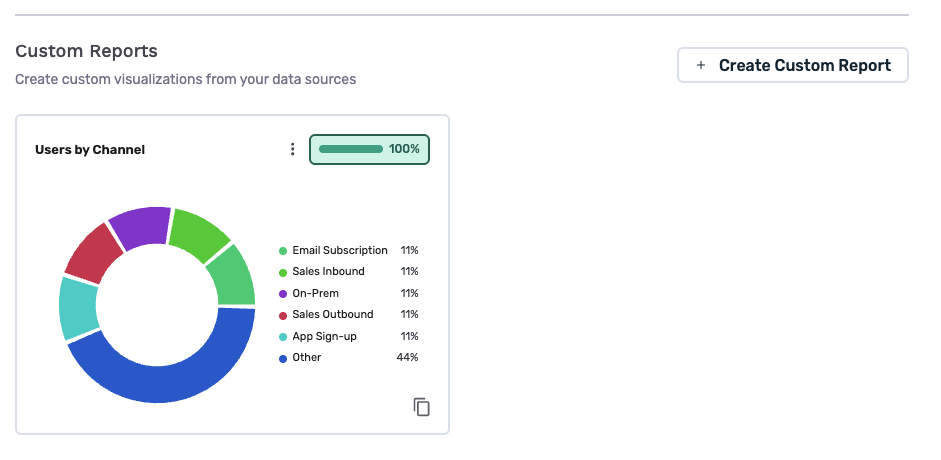
- Custom Reports: saved user-defined graphs, when Custom Reports are enabled for your organization.
Each graph shows how Audience members are distributed across an attribute. Graphs may show a loading state while GrowthLoop prepares the underlying Insights data. It may take a minute or more to fully load all graphs depending on the size of the Audience. Graphs showing a mapping prompt or a lock are not available and require either mapping the field, if available, or contacting GrowthLoop to use Audience Acuity data.
Data sources
Audience Insights can use first-party data and Audience Acuity data.
| Data source | How it works |
|---|---|
| First-party data | Data from your Dataset Group. GrowthLoop uses mapped fields such as email, phone_number, age, gender, income, language, homeownership, state, zip, and country to power standard graphs and contact counts. |
| Audience Acuity (AA) | Enrichment data available through an Audience Acuity subscription. AA can power graphs such as education, occupation, household composition, and age of children. |
Coverage indicators explain how much of the Audience contributed to a graph. When both first-party and Audience Acuity data are available for the same graph, first-party data takes priority. When an AA-backed graph is not available to your organization, the graph appears locked.
Map fields for Insights
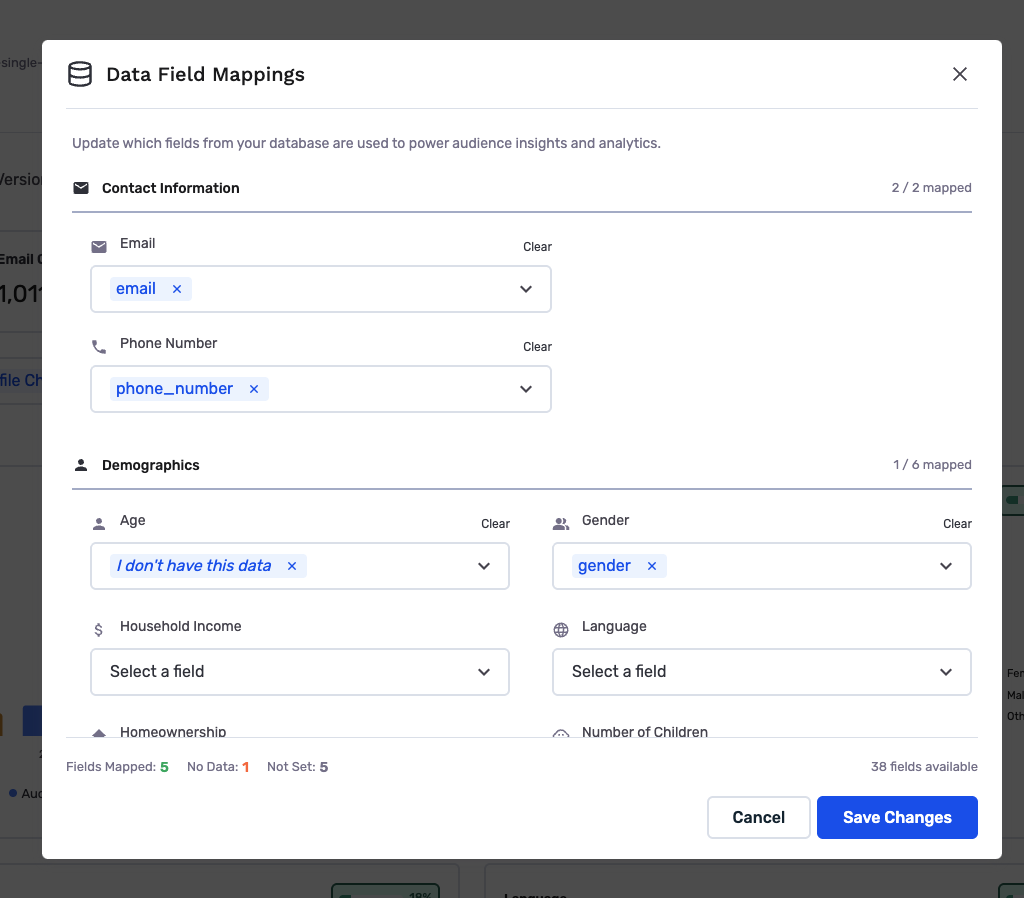
Click the settings button in the Composition section to open the Insights field mapping modal. Use this modal to map Dataset Group fields to Insights fields.
Contact mappings
Map these fields to populate contactability counts:
- Phone number
Demographic mappings
Map these fields to populate first-party composition graphs:
- Age
- Gender
- Household income
- Language
- Homeownership
- Number of children
Geography mappings
Map these fields to populate the geography graphs:
- State
- Zip
- Country
You can also mark a field as absent when your Dataset Group does not contain a usable field for that slot. After you save mappings, the page shows an updating state while the Insights data refreshes.
Standard graphs
Standard Insights graphs appear in a stable order. Their availability depends on field mappings, Audience Acuity availability, and enrichment coverage. For graphs that can use both first-party and Audience Acuity data, GrowthLoop uses first-party data when it is available.
| Graph | Source |
|---|---|
| Age | First-party age or birthdate mapping, with Audience Acuity support when available |
| Gender | First-party gender mapping, with Audience Acuity support when available |
| Household Income | First-party income mapping, with Audience Acuity support when available |
| Language | First-party language mapping, with Audience Acuity support when available |
| Homeownership | First-party homeownership mapping, with Audience Acuity support when available |
| Children in Household | First-party number-of-children mapping, with Audience Acuity support when available |
| Education Level | Audience Acuity only |
| Occupation | Audience Acuity only |
| Household Composition | Audience Acuity only |
| Age of Children | Audience Acuity only |
| Geographic Distribution | First-party state, zip, or country mapping, with Audience Acuity support when available |
| Top States | Derived from Geographic Distribution |
| Top Countries | Derived from Geographic Distribution |
The geography map is the canonical geography graph. Top States and Top Countries are derived views from the same geography Insights data.
Compare Audiences
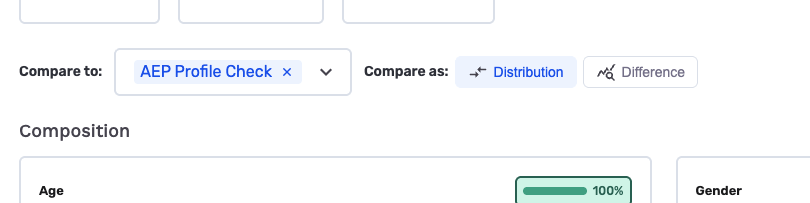
When Audience Comparison is enabled, use the comparison control to compare the current Audience to another Audience in the same Dataset Group.
Two comparison modes are available:
- Distribution: shows each Audience's percentage distribution for the same graph buckets.
- Index: shows the percentage difference between the current Audience and the comparison Audience for each bucket.
Comparison data is fetched from the comparison Audience's cached Insights data. If the comparison data is unavailable or still processing, the page shows an inline status while keeping the current Audience Insights visible.
Create Custom Reports
When Custom Reports are enabled, use Create Custom Report to save additional graphs for an Audience.
To create a custom report, choose:
- Data source: Data Warehouse or Audience Acuity.
- Attribute: the field to graph.
- Optional boolean filters: boolean fields that narrow the custom graph before selecting the final attribute.
- Chart type: bar, pie, or horizontal bar.
- Cutoff: the maximum number of buckets to display. When omitted, GrowthLoop uses 10 buckets.
- Title: the saved display title for the graph.
The modal shows a preview before saving. A custom report can be saved after the preview succeeds and the report has a title.
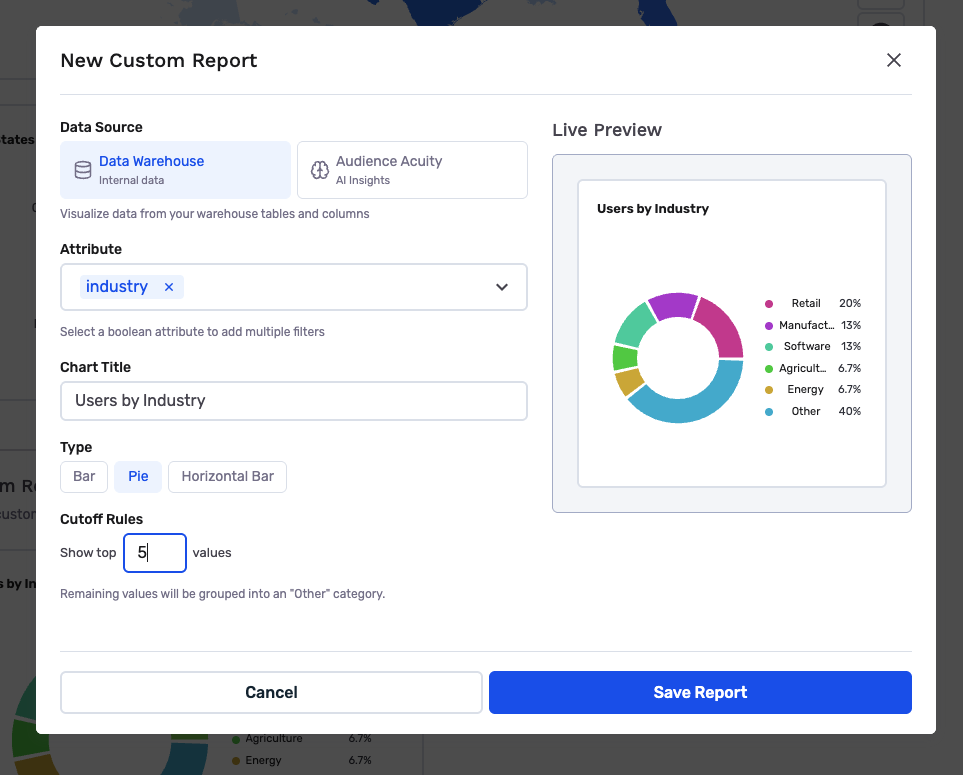
Data Warehouse custom reports use fields from the Audience's Dataset Group. Audience Acuity custom reports use available Audience Acuity enrichment fields when Audience Acuity is enabled for your organization.
Saved custom reports appear in the Custom Reports section.
Updated 2 months ago