
Monitor a Journey
Learn how to monitor your journeys after they are published
In this article, you'll learn how to monitor how your users are flowing through your journeys once they are published.
There are a few ways to see how users are running through your journey:
- Live Viewer: This gives you a live understanding of where users are in your journey.
- Activity Tracker: Allows you to see every step that is processed in your journey and if any errors occurred while that step was processing. This is great for debugging and gives you full visibility into every process that runs in your journey as users advance through.
- In your Data Cloud: See every user in each node of your journey by querying your data cloud.
Live Viewer
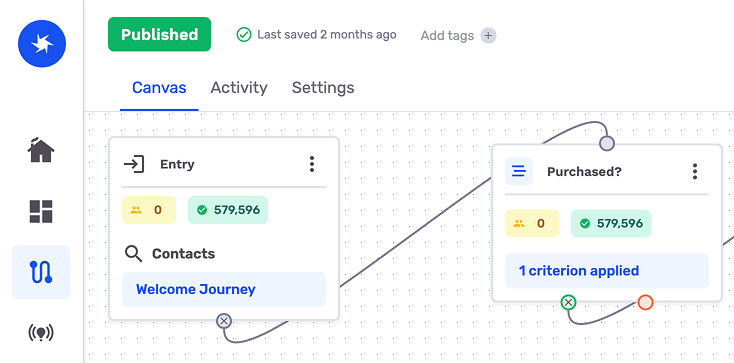
To view where users are sitting in your journey at a glance you can use Journey Live Viewer.
-
Click on Journeys in the left-hand menu.
-
Select your Published Journey
-
On each journey step you can see:
- In Process: Number of users that are currently in journey step.
- Completed: Number of users that have completed step.
-
On each journey step you can see:
-
In Process: Number of users that are currently in journey step.

-
Completed: Number of users that have completed step.

-
- Here is what it looks like on Canvas:
Activity Tracker
The Journey Activity Tracker helps you dive deeper and understand when, how, and the result of every step that is processed in your journey. This is the fastest way to debug your journeys and ensure they are operating exactly as you expect.
-
Click on Journeys in the left-hand menu.
-
Select your Published Journey.
-
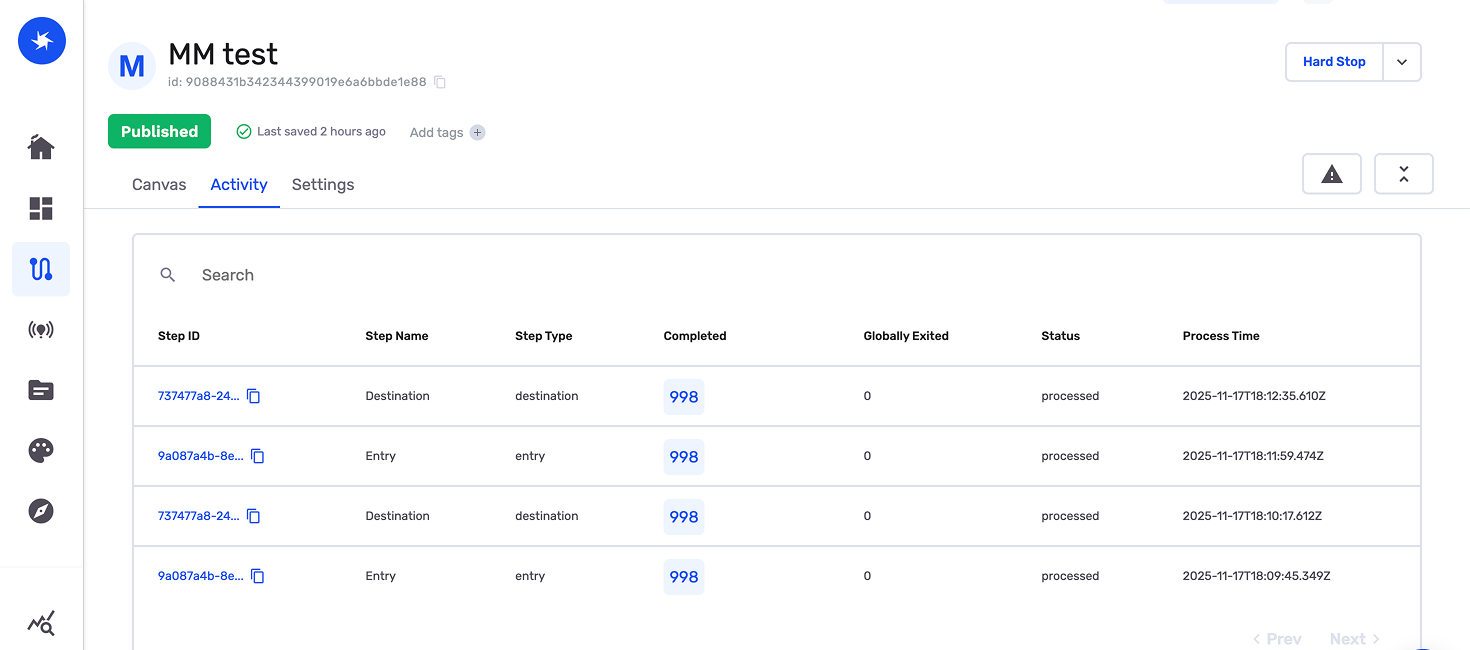
Select Activity tab in the journey sub-menu.
-
In the Activity Tracker you can see every step, when it was processed, and the result.
-
Step ID: This is the Unique Identifier for the Journey Step that was processed.
-
Step Name: This name of the step (the name you provided) on Journey Canvas.
-
Step Type: This is the type of step: Entry, Criteria, Destinations, Experiments, and Delay.
-
Completed This shows the result of processing the step.
-
Criteria Step : Show how many users went down the Yes path and No path.
-
Delay Step: Show how many users completed the delay and advanced to the next node.
-
Destination: Show how many users were processed and sent to destination.
-
Experiments: Show how many users were allocated and advanced in that experiment variation.
-
Globally Exited: Show how many users were exited from your journey while this step was processed because they met your global exit criteria.
-
Status
- Processed: This shows you that the journey node was successfuly processed.
- Error: This shows you that the node had an error while processing. You can click the Error to view more details and gain an understanding of what caused the users to not be successfully processed at that journey step.
-
Process Time: Shows you when the journey step was processed.
-
-
In Your Data Cloud
For analytics and technical users, the best part of using GrowthLoop on your data cloud is you can run a simple SQL query and see where every user is within a journey right within your data cloud.
GrowthLoop stores journey state tables directly in your data cloud, so you can:
- See what users are in a particular step of your journey right now
- See what users are in a particular step of your journey on any date in the past
- See how many users are in more than 1 active journey today.
- See how many users have never been in a journey.
Review our Journey Data Cloud Storage documentation to get started.
Updated 8 months ago