
Audience Experimentation
Measure real campaign impact with treatment and control groups.
GrowthLoop Advanced Experimentation Suite allows you to understand the incrementality your campaign is actually driving. Audience Experimentation lets you compare customers who received your campaign against those who didn't, and measure the causal impact on the KPIs that matter to you.
This feature builds on two other GrowthLoop capabilities:
- Metrics Builder -- define the KPIs you want to track
- Audiences -- build the customer segments you want to target
Prerequisites
Before setting up an experiment, you need:
- At least one metric created via the Metrics Builder that tracks a numeric value (e.g., revenue, purchase count, engagement score).
- An audience built from the same Dataset Group as your metric, so GrowthLoop can evaluate the metric across your customer segments.
NoteIf no appropriate metric is selected and experimentation is turned on, export is not possible.
NoteOnly metrics where the underlying field is a numeric type (numbers, integers, decimals) can be used in experiments. Non-numeric fields like text or dates are not eligible.
Set up an experiment
- Navigate to Audiences in the left sidebar and open the audience you want to test.
- Open the Experiments tab within the audience.
- Select a single metrics to track. GrowthLoop displays the current mean for each metric across your audience, giving you a baseline before the experiment begins.
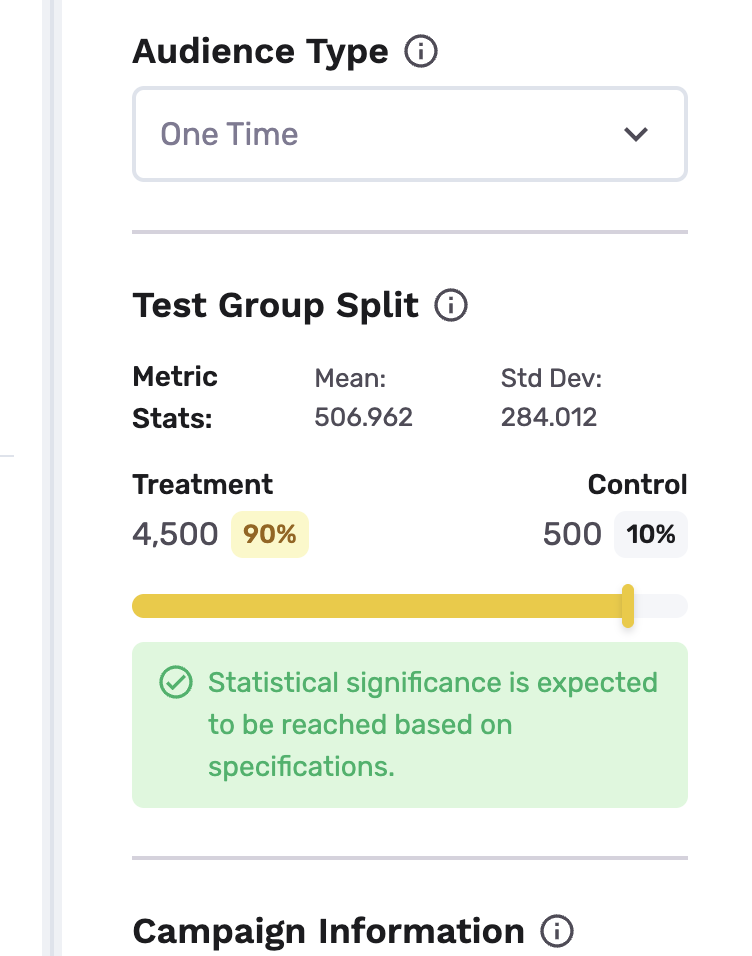
- For one-time audiences, treatment/control split automatically defaults to the most efficient split that keeps the control group the smallest while still being expected to reach StatSig (statistical significance) based on advanced forecasting over experimentation settings
- For ongoing audiences, treatment/control split automatically defaults to the most efficient split that keeps the control group the smallest while still being expected to reach StatSig based on advanced forecasting over experimentation settings over a preselected 10-day runtime
- Campaign information settings: This allows the system to understand campaign settings and goals in the target destination, for most accurate forecasting and measurement. Set up campaign start date (When is the campaign scheduled to start on the destination), attribution window (How long after campaign start should effects be tracked for treated customers), campaign length (the number of days your campaign will run for) and the marketing campaign for the treatment group (free text)
- Advanced Settings: Set up desired confidence level (Higher confidence reduces the risk of positive effects being generated by chance, but increases the amount of data needed to reach a conclusion. We suggest to leave the setting unaltered. Default: 0.8); statistical power (Higher desired power reduces the chance of missing a true win, but requires more data and time to run the test. We suggest to leave the setting unaltered. Default: 0.7) and expected lift in primary metric in % (Your estimate of the expected effect size, expressed in percentage increase over the current mean. Default: 5%) and auto-roll-out behavior (only for ongoing audiences. Winner to 100%: Rolls out treatment condition to 100% of traffic once statsig is reached, or the control group does not win with StatSig. Notify only: Keep current split and notify me first. Default: "Winner to 100%".)
- Click Export to send the audience to your destination. Only the treatment group is exported; the control group is held back automatically.
NoteOnly continuous exports are supported for ongoing audiences, and only one-time exports are supported for one-time audiences.
Once exported, GrowthLoop begins tracking your metric values for both groups over time and writing evaluation data to tracking tables in your data cloud.
Always-on measurement
For ongoing audiences, GrowthLoop introduces the concept of always-on measurement. After your experiment has reached StatSig, the export is automatically scaled to 100% of new audience members unless the control group, i.e. no audience export, has won with statistical significance based on alpha derived from advanced settings, meaning there is a loss incurred vis-a-vis metric if the experiment was scaled. Running counterfactual Machine Learning during the experiment allows us to understand the outcome for each individual under treatment and the counterfactual outcome for each individual under control, even if every user will get assigned to the treatment group. Note:
NoteThis capability is not available for "one-time" audiences. For ongoing audiences, users can turn on always-on measurement by contacting their account manager
Concept Explanation: Instead of holding back real customers, we use the initial experiment period to train a predictive model as a "Digital Twin" of your control group. This has two functions:
- Understand the effect of each intervention in perpetuity even if the control group exists no longer
- Serves as an early warning sign when campaigns scaled up do not achieve the initial ROI anymore
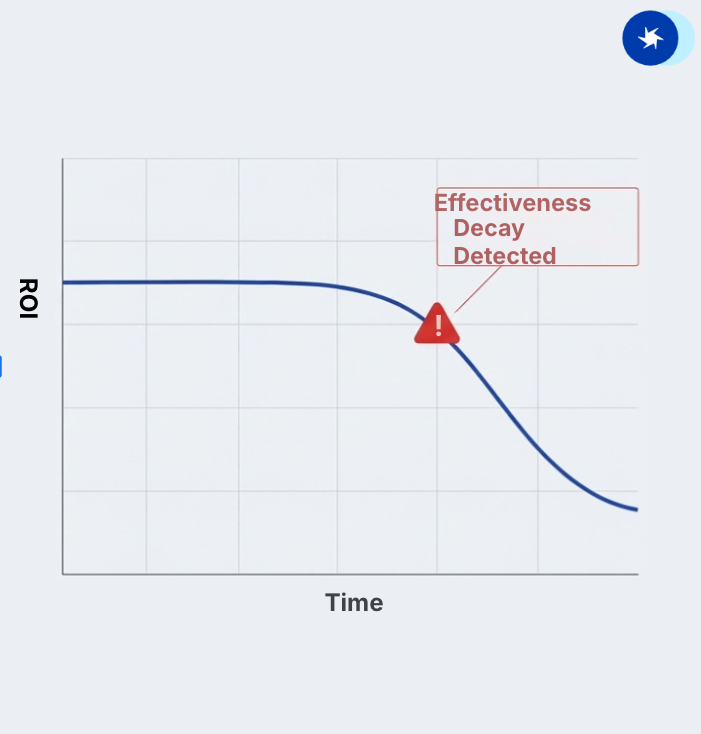
NoteWe can assess model fit of this model because we can compare the accuracy of predicted outcomes under treatment and predicted outcomes under control. If this accuracy decays, we suggest re-experimentation. Our CSG team will contact you should that be the case.
Read the experiment dashboard
Once evaluation data is available, the Experiments tab transforms into a dashboard showing how your campaign is performing.
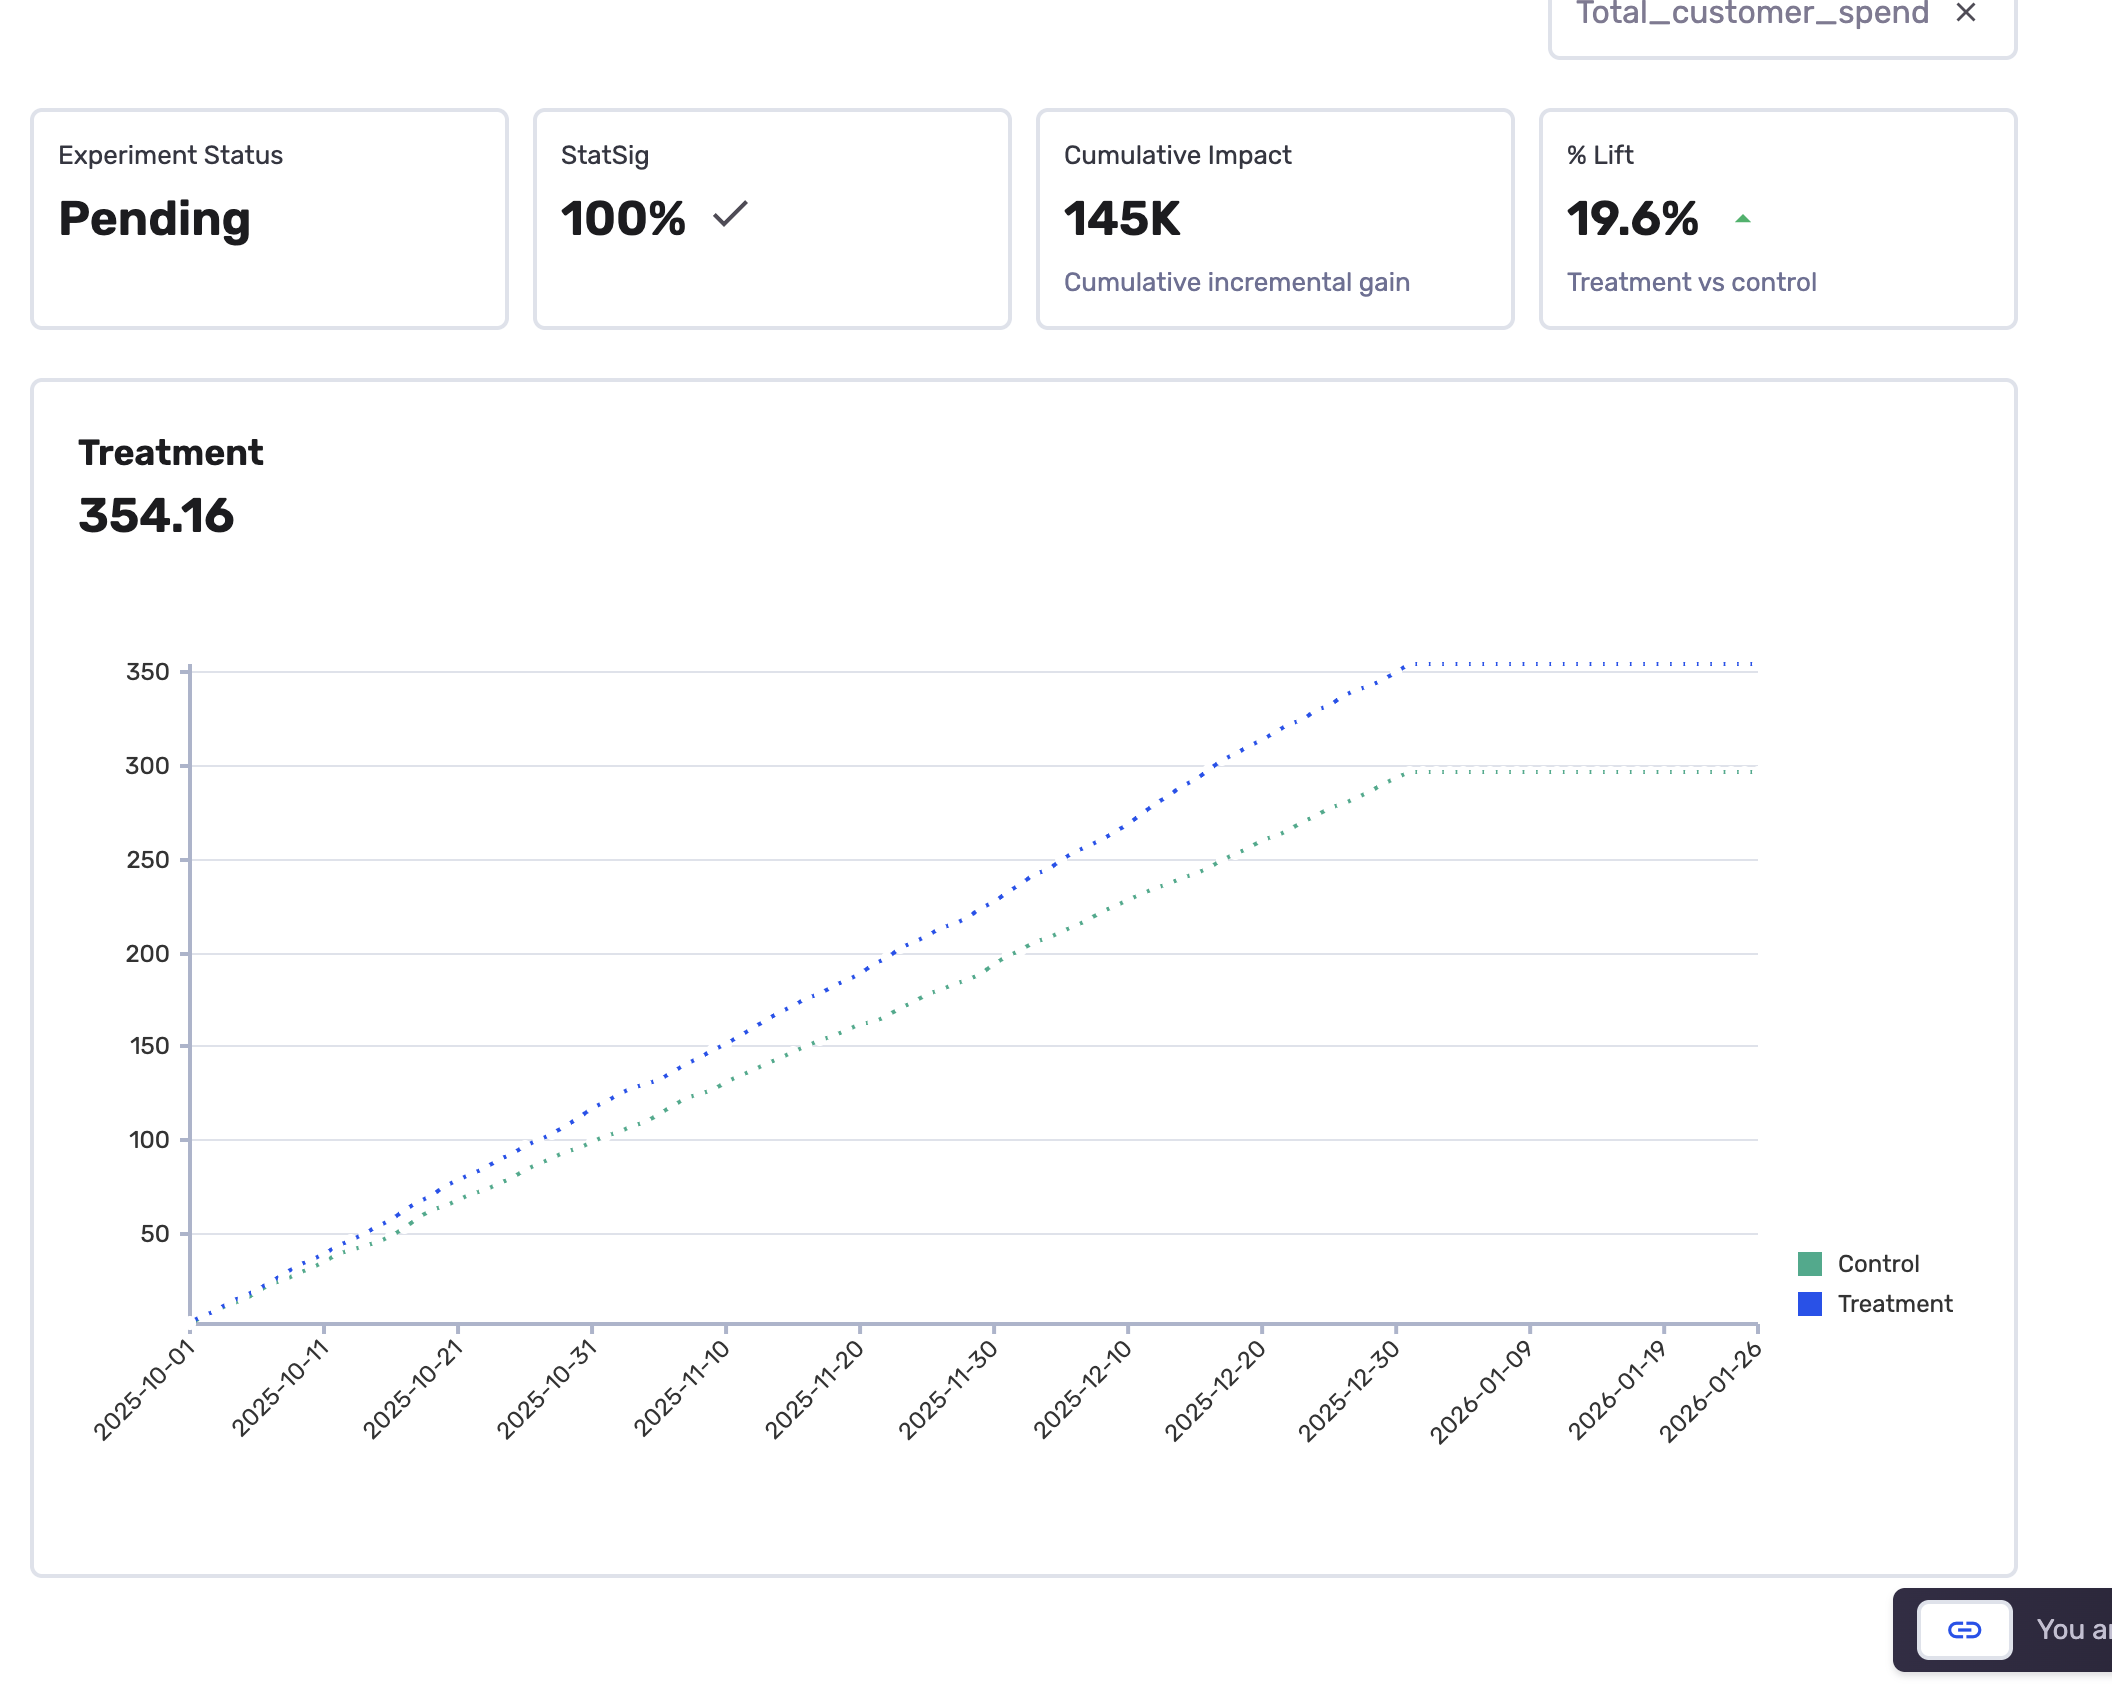
The chart
The chart plots your metric values over time for both groups:
- Treatment line -- the metric value for customers who received the campaign
- Control line -- the metric value for customers who did not receive the campaign
Summary statistics
The dashboard highlights key numbers at the top:
| Metric | What it tells you |
|---|---|
| % Stat Sig | How close is the experiment to statistical significance based on the advanced settings specified in the builder |
| Relative uplift | The percentage improvement of the treatment group over control. For example, "28% uplift" means the treatment group's metric value is 28% higher than the control group. |
| Cumulative impact | The total estimated impact of your campaign over the measurement period. |
Example: measuring an email campaign
Here is a concrete example -- measuring whether a promotional email increases total purchase amount.
- Create a metric called "Total Purchase Amount" in the Metrics Builder. Choose the
transactionsDataset, select thepurchase_amountfield, set the calculation method to Total, and pickorder_dateas the date field. - Create an audience called "Active Shoppers" from the same Dataset Group. Set the criteria to customers who made a purchase in the last 90 days, and cconfirm the suggested control splt.
- Assign the metric in the Experiments tab. Note the baseline mean before you start.
- Export the audience to your email platform (e.g., Braze, Iterable). The treatment group receives your promotional campaign; the control group receives nothing.
- Check results after two weeks. Your dashboard shows the treatment group is spending about 25% more than the control group, with StatSig reached 100%
Best practices
- Match your metric to your campaign goal and attribution window. Running a re-engagement campaign? Track purchase frequency or login count -- not just revenue.
- Don't change a metric's configuration mid-experiment. If you need a different view, create a new metric instead.
Frequently asked questions
How long until I see results? Evaluation data begins accumulating after you export the audience. Meaningful results typically appear post the attribution window for one-time audiences, and post the experiment runtime for ongoing audiences, if the experiment runtime is longer than the attribution window.
Where is the evaluation data stored? GrowthLoop writes evaluation data to tracking tables in your own data cloud, within the GrowthLoop system schema. Your data never leaves your environment.
Can I run experiments on any audience? Yes. Any audience can be set up with treatment/control groups. The audience just needs to share the same underlying Dataset Group as your metrics.
Congrats on setting up your first experiment! You're now measuring real campaign impact.
NoteExperiencing any issues? Reach out to us at [email protected] and we'll help resolve the matter.
Updated 3 months ago