
Create a Metric
Build your first metric to track a KPI across campaigns.
In this guide you will create your first metric -- the KPI you want to track across your campaigns. Need a refresher on what metrics are and how they work? Check out the Metrics Builder overview.
Prerequisites
Before you create a metric, make sure you have:
- At least one Source connected -- this is the data cloud where your data lives. See Sources overview for setup instructions.
- A Dataset Group configured with the Datasets you want to use.
Step-by-step guide
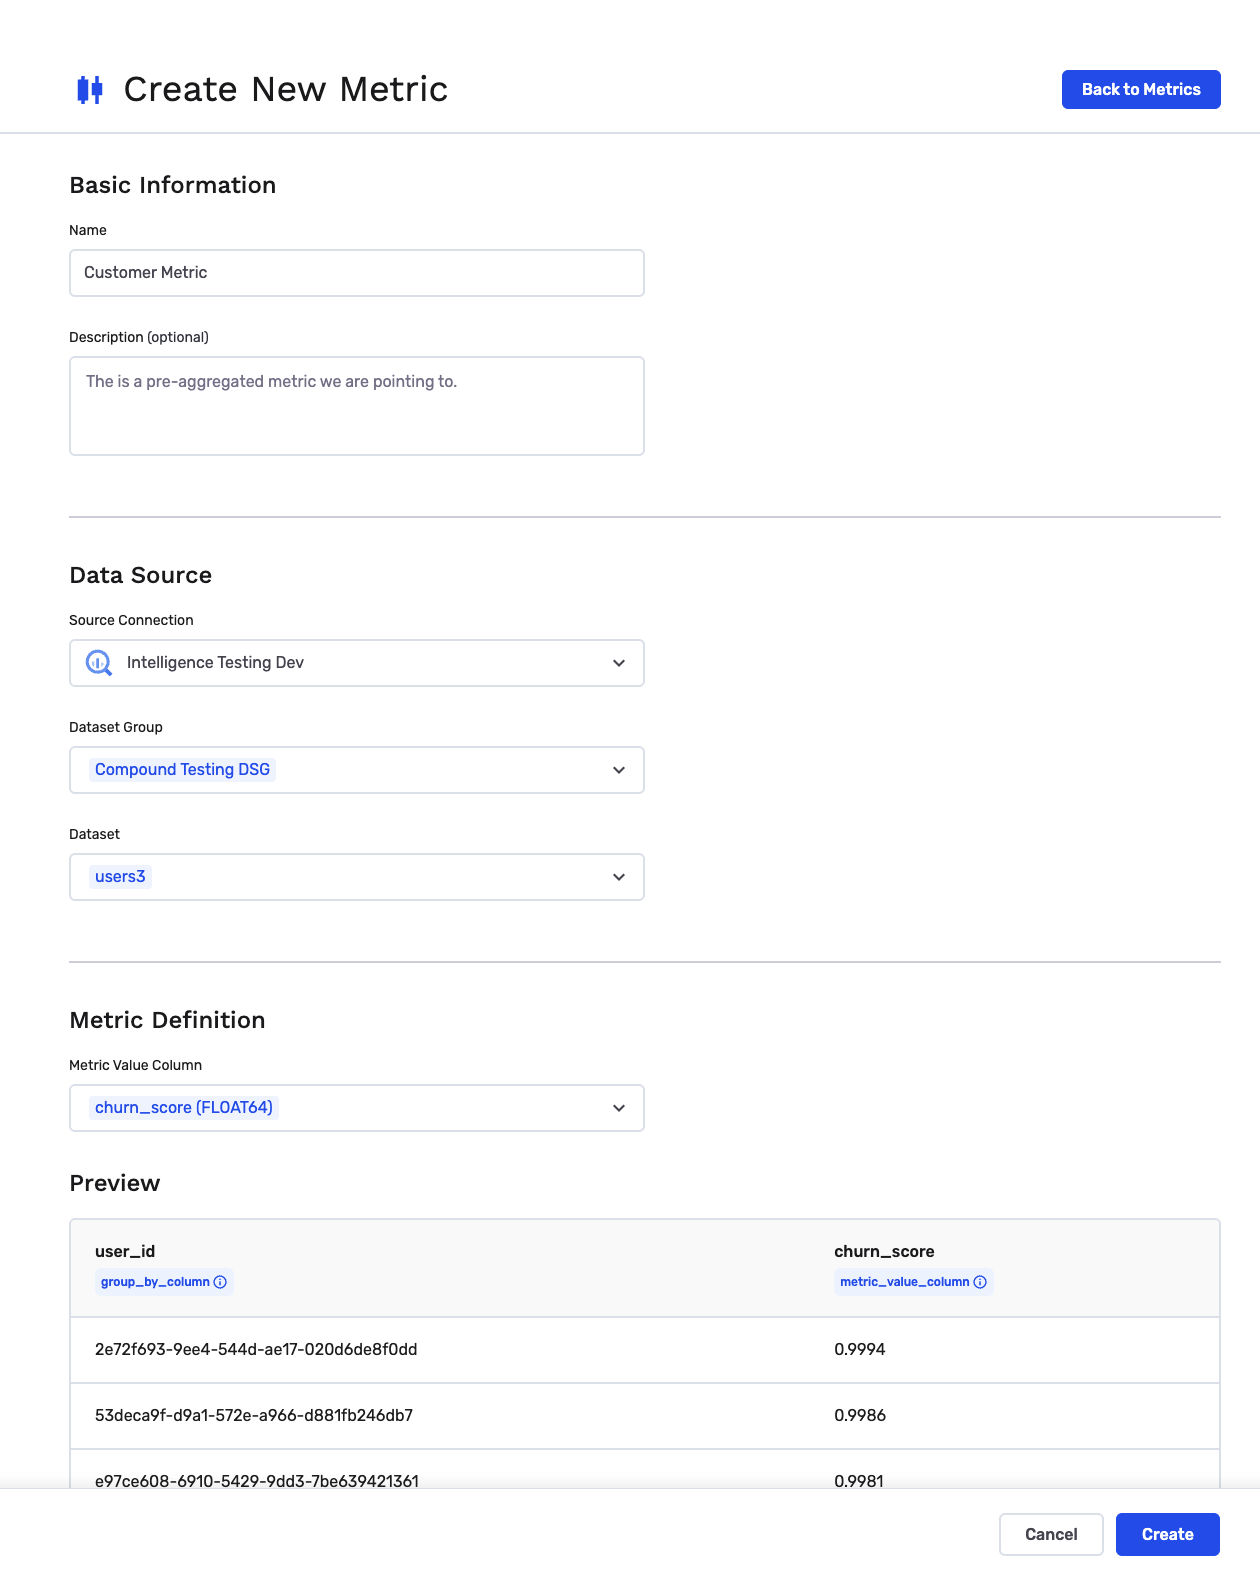
Customer metric
Use this when your Dataset already contains a final value per customer -- like a lifetime value score, a churn risk score from an external model, or a loyalty tier. GrowthLoop reads the value as-is without applying any additional calculations.
- Navigate to Metrics in the left sidebar.
- Click New Metric in the upper right corner.
- Enter a name and optional description for your metric.
- Select your Source -- the data cloud where this data lives.
- Select a Dataset Group and Dataset -- choose the table that contains the pre-computed values (for example, a customer details or customer metrics table).
- Select the metric field -- the column containing the value you want to track.
- (Optional) Click Preview to see a sample of the data.
- Click Create to save.
NoteBecause this metric uses a pre-computed value, GrowthLoop reads it directly from your data. No additional calculation is applied -- any processing or transformation of this data is managed by you outside of GrowthLoop.
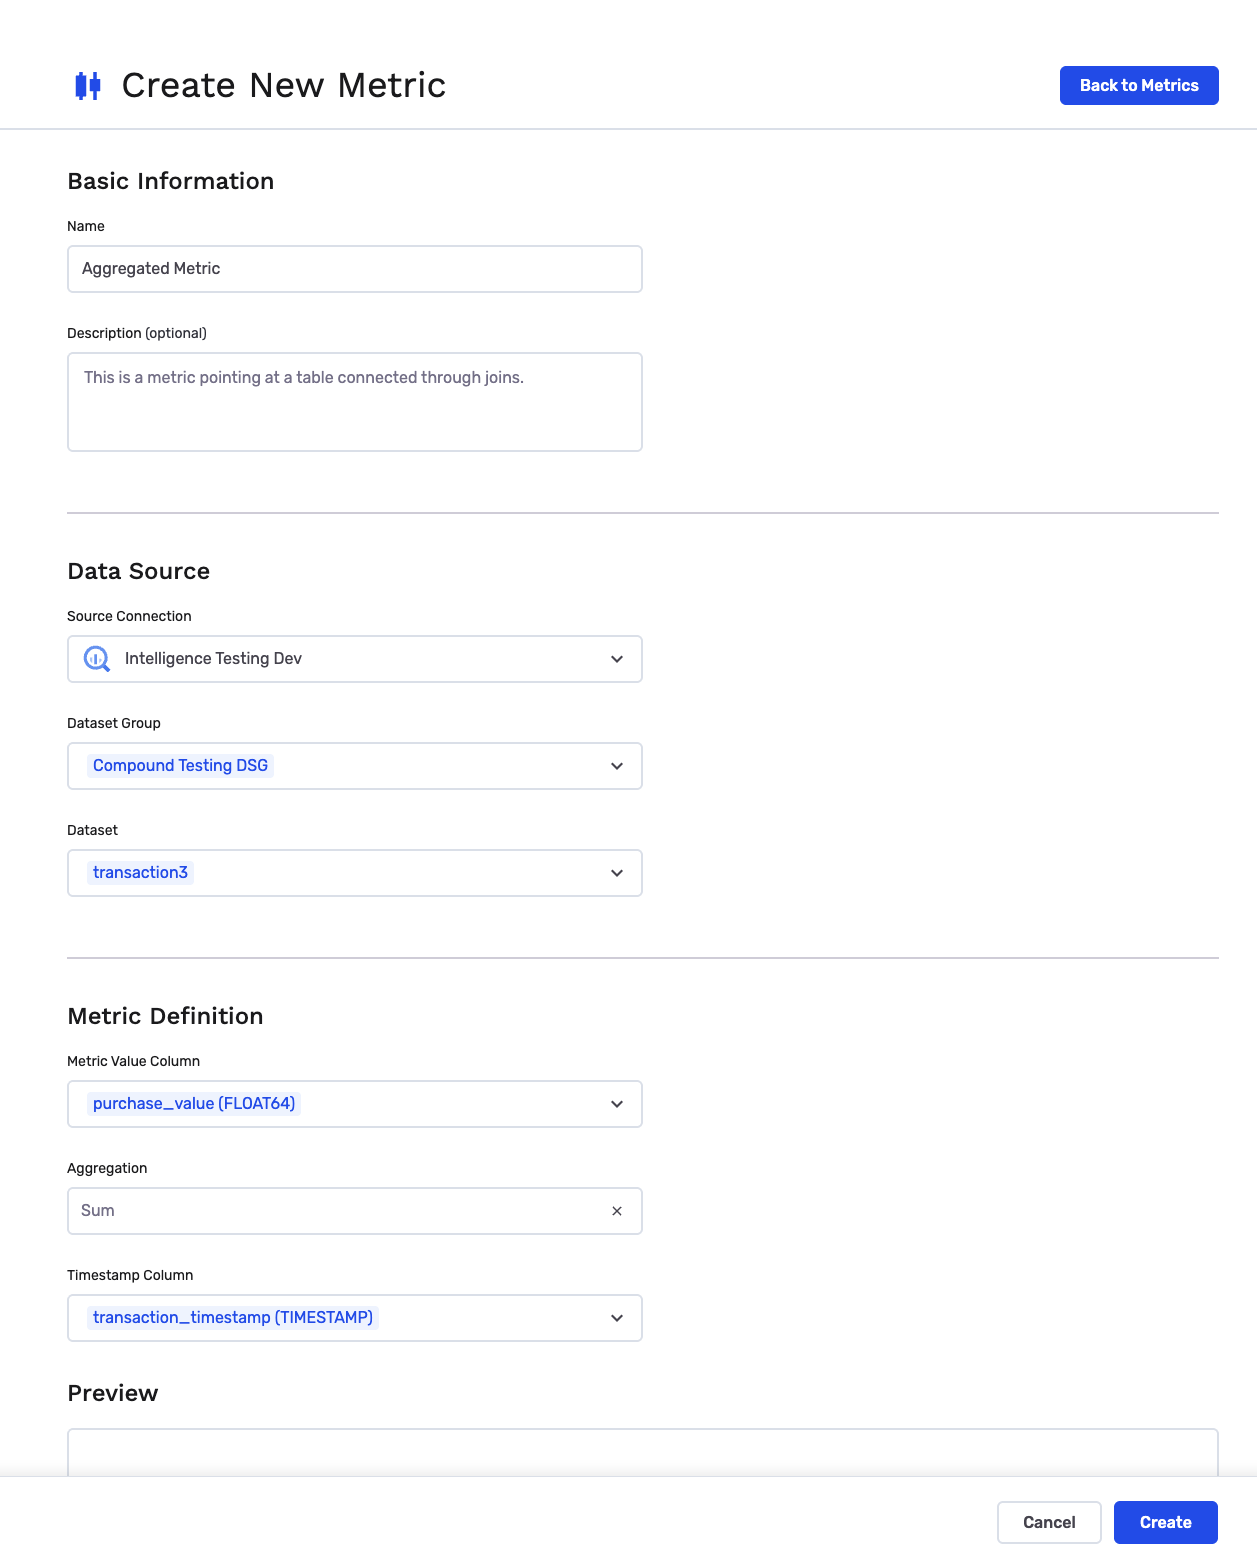
Aggregated metric
Use this when you have raw event data -- like individual purchase transactions -- and you want GrowthLoop to calculate a total, average, or count per customer for you. This works with a typical setup where you have a primary customer table joined to an events or transactions table.
- Navigate to Metrics in the left sidebar.
- Click New Metric in the upper right corner.
- Enter a name and optional description for your metric.
- Select your Source -- the data cloud where this data lives.
- Select a Dataset Group and Dataset -- choose the events or transactions table (for example,
ordersortransactions). - Select the metric field -- the column with the value to aggregate (for example,
purchase_amountororder_total). - Choose a calculation method -- how GrowthLoop should roll up the values per customer:
| Method | What it does | Example |
|---|---|---|
| Total | Adds up all values | Total spend across all orders |
| Average | Mean of all values | Average order value |
| Count | Number of records | Number of purchases |
| Min | Smallest value | Lowest transaction amount |
| Max | Largest value | Highest transaction amount |
- Select a date field -- the column that indicates when each record was created (for example,
created_atororder_date). This enables time-based analysis. - (Optional) Click Preview to see a sample of the aggregated results.
- Click Create to save.
TipUse the Preview to verify your metric looks right before saving. It shows a sample of the calculated results so you can confirm you selected the right field and calculation method.
Preview your metric
When creating or editing a metric, the Preview section shows a sample of what your metric data looks like. For customer metrics, the preview displays the per-customer values directly. For aggregated metrics, it shows the result after applying your chosen calculation method. This is a great way to verify everything is set up correctly before saving.
Congrats! You've created your first metric. Head to Manage Metrics to learn how to view, edit, and organize your KPIs.
NoteExperiencing any issues? Reach out to us at [email protected] and we'll help resolve the matter.
Updated 4 months ago