
Billing
Monitor warehouse compute costs associated with GrowthLoop activity.
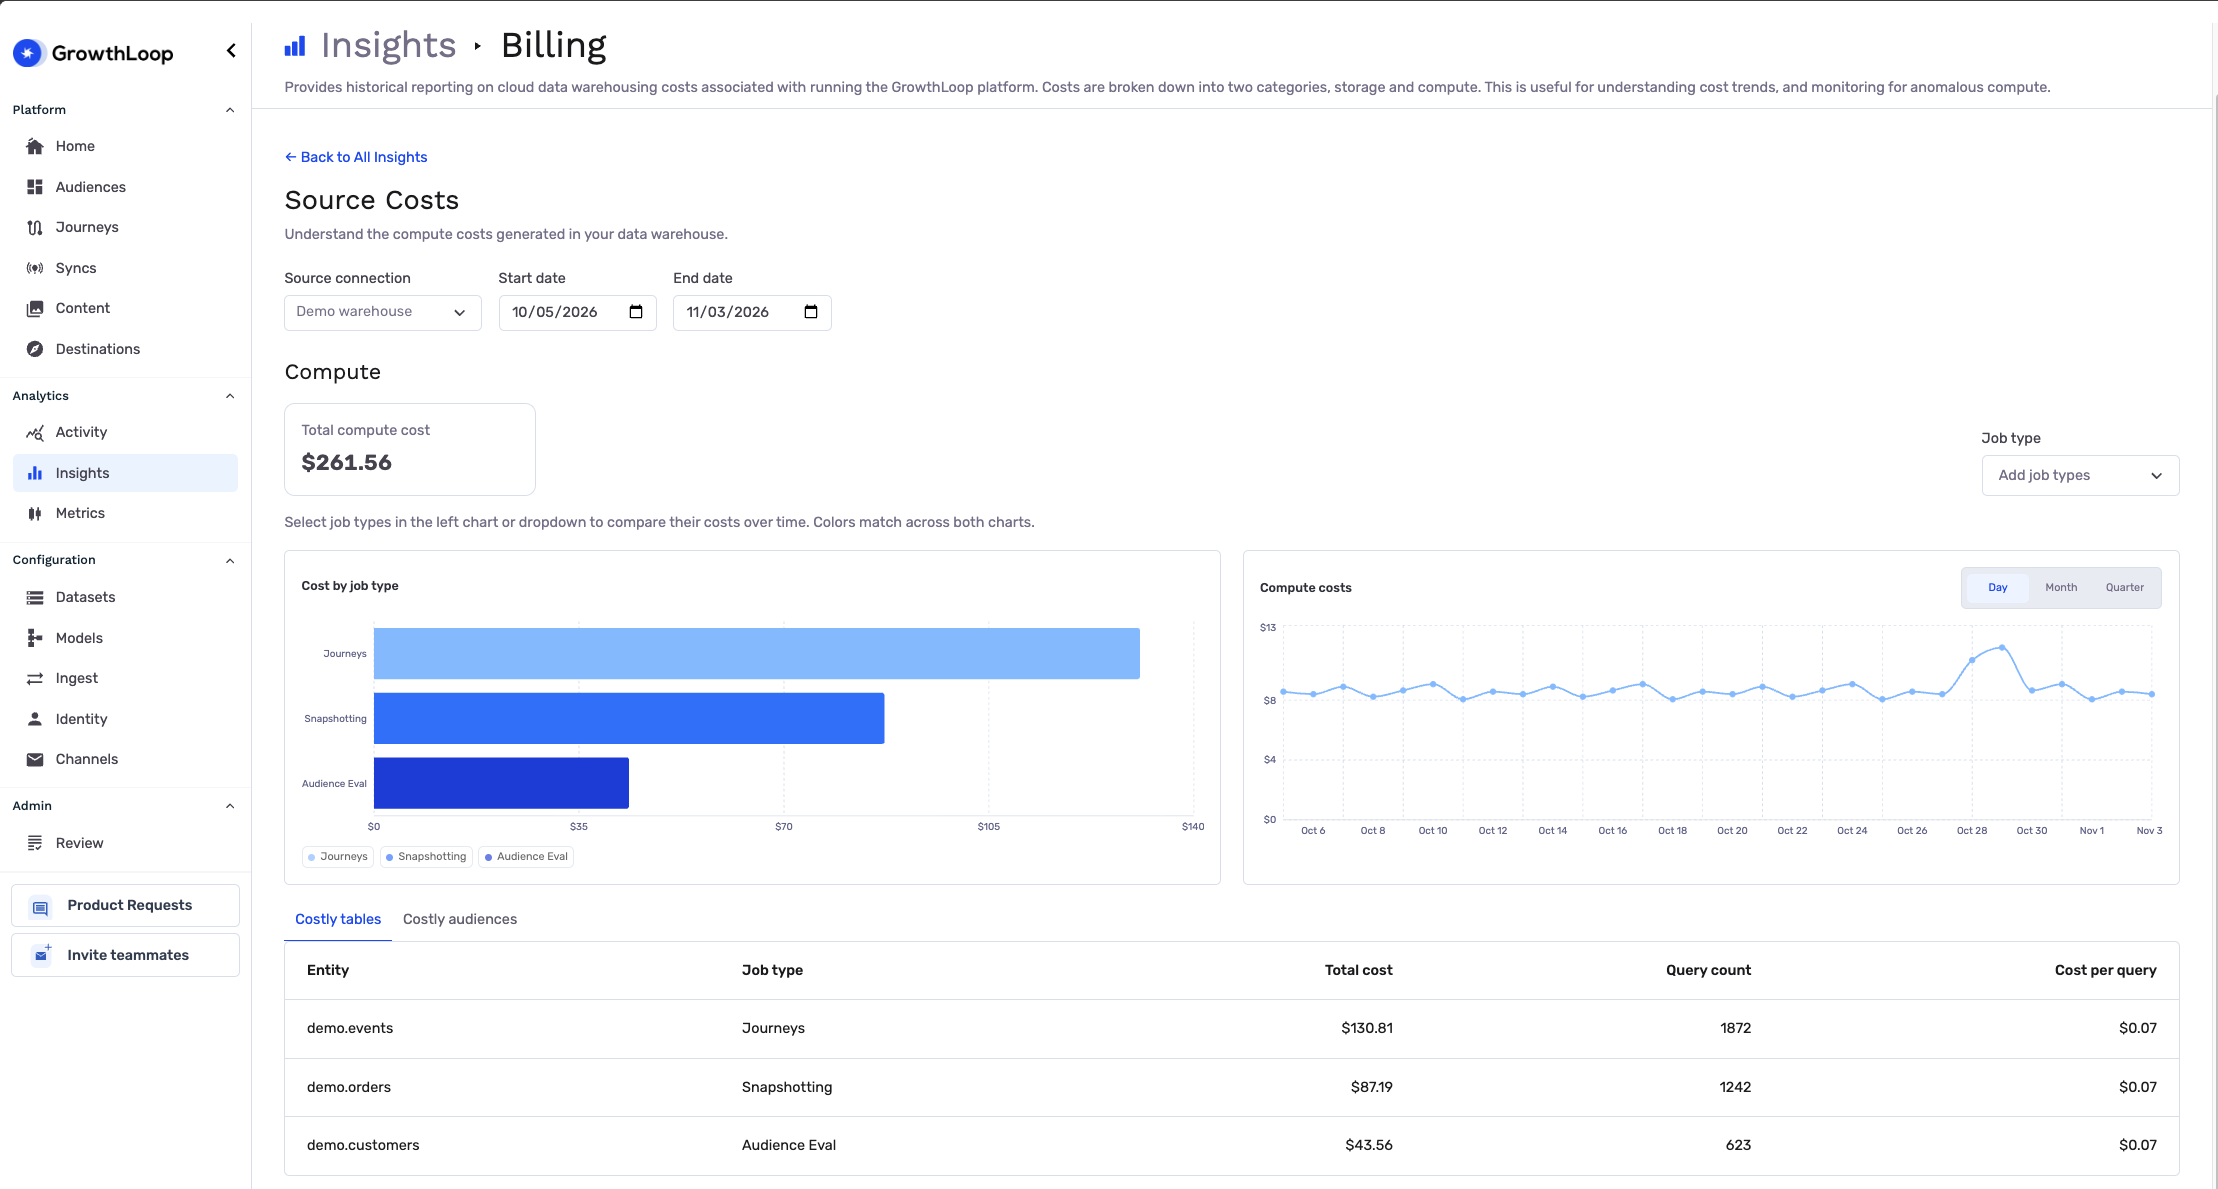
Open Billing in Insights to review the warehouse compute costs associated with GrowthLoop activity. The report opens as Source Costs, where you can compare job types and identify tables or audiences associated with higher costs.
Prerequisites
- A GrowthLoop admin must enable the Billing organization setting before you can use this feature. Contact [email protected] if the report is locked.
- Use an account with permission to edit organization settings and access all Sources in your organization. Ask your administrator to confirm your permissions.
- Have a BigQuery or Snowflake Source with billing reporting data available. Ask support to confirm reporting setup if the report has no data.
Review warehouse costs
- Click Insights in the left sidebar.
- Select the Billing tile to open Source Costs.
- Select a Source connection at the top of the report. This report supports BigQuery and Snowflake.
- Set Start date and End date. The default range covers 30 calendar days, including today.
- Review Total compute cost, Cost by job type, and the Compute costs trend chart in Compute. Select Day, Month, or Quarter above the trend chart to change the time grouping. The default is Day.
- Select one or more job types in the Job type dropdown or click their bars in Cost by job type to compare costs over time. Click Show total to clear the selection.
- Select Costly tables or Costly audiences below the charts to identify the highest-cost entries for the selected dates and job types.
Understand the results
The report reads available warehouse compute-cost reporting data and displays costs in USD. Use it to investigate trends in GrowthLoop activity. The current Source Costs view reports compute costs; it does not show storage charges or your GrowthLoop subscription invoice.
| Result | Meaning |
|---|---|
| Total compute cost | The sum of reported compute costs for the selected dates and job types |
| Cost by job type | The distribution of compute costs across job types for the selected dates |
| Compute costs | Reported compute costs grouped by day, month, or calendar quarter, with separate series when you select job types |
| Costly tables | Up to 10 highest-cost table and job-type entries for the selected filters |
| Costly audiences | Up to 10 highest-cost audience entries with an audience identifier in the billing data |
| Total cost | The sum of reported compute costs for a table or audience row |
| Query count | The sum of reported query frequencies for a row |
| Cost per query | Total cost divided by query count; zero when query count is zero |
Changing between Day, Month, and Quarter changes the trend chart's time grouping within your selected dates. To investigate a single day across the report, set both date fields to that day.
Selecting job types filters Total compute cost, the trend chart, and the costly-entry tables. Cost by job type continues to show the distribution across all job types for the selected dates, so you can add or remove categories from the comparison.
Investigate a cost increase
- Select the source and dates covering the increase.
- Select Month or Quarter on the Compute costs chart to review broader trends.
- Select Day to find the specific day with a spike. Hover over a point to review its date and cost.
- Review Cost by job type and select job types to see which contributed to the daily increase.
- Set Start date and End date to the day you want to investigate. This narrows the totals, charts, and tables to that day.
- Open Costly tables and Costly audiences to identify entries to review with your data team.
You're all set! Share the source, date range, and relevant job types with your data team to investigate warehouse compute usage.
Troubleshooting
These are the issues we see most often. You can always email us at [email protected] for help.
| Problem | Cause | Resolution |
|---|---|---|
| Billing is locked | The organization setting, report availability, or required permissions are missing. | Ask support to check Billing enablement, and ask your administrator to confirm organization and Source permissions. |
| Your Source is not listed | Source Costs supports BigQuery and Snowflake. | Select a supported Source. |
| No billing data was found for these filters | The selected dates or job types have no available billing rows. | Widen the date range, click Show total, and confirm billing reporting setup with support. |
| Costly audiences does not account for all compute costs | Some billing rows have no audience identifier. | Use Cost by job type and Costly tables to review other compute activity. |
| The cost report is unavailable | GrowthLoop could not load the report. | Try again. If the problem persists, send support the source, dates, and error message. |
Updated about 1 hour ago